Monitor Table Health in Looker & Get Slack Alerts
👀 Who Should Read This?
Anyone who:
- Cares about data quality
- Wants to trust the table and be confident to use the numbers from it
🧠 TL;DR
A lightweight framework to monitor data quality at the result level, not pipeline level. It collects table statistics over time in BigQuery*, visualizes trends in Looker, and alerts anomalies in Slack.*sample logic will be provided, which you can implement in other SQL based DB or pipelines.So you can answer: “Is this Explore/dashboard still using healthy data?”
⚠️ This NOT a framework about Data Job⏱ or Pipelines🚰, but about Result📈📉, the confidence of usability.
- We’re not watching job runtimes or DAG failures.
- We’re watching for something more subtle:
📊 Table Statistics You Should Track between Source Table and Target Tables
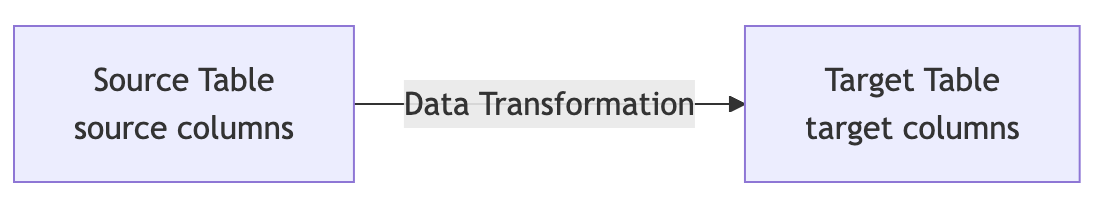
- source table: could be a staging table directly read from API
- target table: could be the aggregation, business tables for reporting, dashboard, modeling which consumed by actual data persons like Data Analyst, Scientists et al.
These metrics give you a historical pulse on the health of your tables:
Metric |
Why It Matters |
| Empty / Null Count | Missing values are a pain in time-series and ML. COALESCE(column, 'Other') can skew distributions. |
| Cardinality | Number of unique values (e.g. status types, channels). Reflects business dynamics. |
| Selectivity | Ratio of cardinality to total rows. Measures data uniqueness. |
| Density | Non-null values / total rows. Primary keys should be near 100%, i.e. amount valid records/rows you will get |
| Min/Max | Useful for numeric columns like transaction_amount, invoice_amount or invoice_date. Watch for variance. |
🛠️ Build & Deploy in BigQuery
the following code sample is a internal bigquery schedule tool called BQ runner in .yaml language, the core logic is this the .sql part with a little help from .jinja template to Set up a YAML config like this:type: query
table_description: |
{policy: { accessTier: BOARD }, description: '{{bq_runner_info}}'}
field_descriptions:
query_args:
source_table_full_name: gcp_project.gcp_dataset.table_to_be_monitored
source_table_type: source
source_column_names:
- column_name_key
- column_name_categorical
- column_name_numeric
- column_others_to_be_monitored
/* ignore below if you don't have a target table to compare - start */ target
target_table_full_name: gcp_project.gcp_dataset.table_to_be_compared
target_table_type:
target target_column_name:
- column_name_key
- column_name_categorical
- column_name_numeric
- column_others_to_be_compared
/* ignore below if you don't have a target table to compare - end */
query: |
{% for col in query_args.source_column_names -%}
UNION ALL
SELECT
"{{ partition. format( 'YYYY-MM-DD') }}" AS partition_date
, {{ query_args.source_table_full_name }}" AS table_full_name
, 'source' AS table_type
, COUNT(*) AS num_rows
, "{{ col }}" AS column_name
, SAFE_CAST(MIN(IF({{ col }}='"', NULL, {{ col }})) AS STRING) AS min_value
, SAFE_CAST(MAX(IF({{ col }}='', NULL, {{ col }})) AS STRING) AS max_value
, COUNT(CASE WHEN IF({{ col }}='', NULL, {{ col }}) IS NULL THEN 1 END) AS num_empty_values
, COUNT(DISTINCT IF({{ col }}='', NULL, {{ col }})) AS num_unique_values
, SAFE_DIVIDE(COUNT(DISTINCT {{ col }}), COUNT(*)) AS selectivity
, SAFE_DIVIDE( (COUNT(*) - COUNT(CASE WHEN IF({{ col }}='', NULL, {{ col }}) IS NULL THEN 1 END)), COUNT(*) ) AS density
FROM `{{ query_args.source_table_full_name }}`
WHERE 1=1
AND DATE(_PARTITIONTIME) = "{{ partition.format( 'YYYY-MM-DD') }}"
GROUP BY 1, 2
{% endfor -%}
{% for tcn in query_args.target_column_name -%}
UNION ALL
SELECT
"{{ partition. format( 'YYYY-MM-DD') }}" AS partition_date
, {{ query_args.source_table_full_name }}" AS table_full_name
, 'source' AS table_type
, COUNT(*) AS num_rows
, "{{ col }}" AS column_name
, SAFE_CAST(MIN(IF({{ col }}='"', NULL, {{ col }})) AS STRING) AS min_value
, SAFE_CAST(MAX(IF({{ col }}='', NULL, {{ col }})) AS STRING) AS max_value
, COUNT(CASE WHEN IF({{ col }}='', NULL, {{ col }}) IS NULL THEN 1 END) AS num_empty_values
, COUNT(DISTINCT IF({{ col }}='', NULL, {{ col }})) AS num_unique_values
, SAFE_DIVIDE(COUNT(DISTINCT {{ col }}), COUNT(*)) AS selectivity
, SAFE_DIVIDE( (COUNT(*) - COUNT(CASE WHEN IF({{ col }}='', NULL, {{ col }}) IS NULL THEN 1 END)), COUNT(*) ) AS density
FROM `{{ query_args.source_table_full_name }}`
WHERE 1=1
AND DATE(_PARTITIONTIME) = "{{ partition.format( 'YYYY-MM-DD') }}"
GROUP BY 1, 2
{% endfor -%}
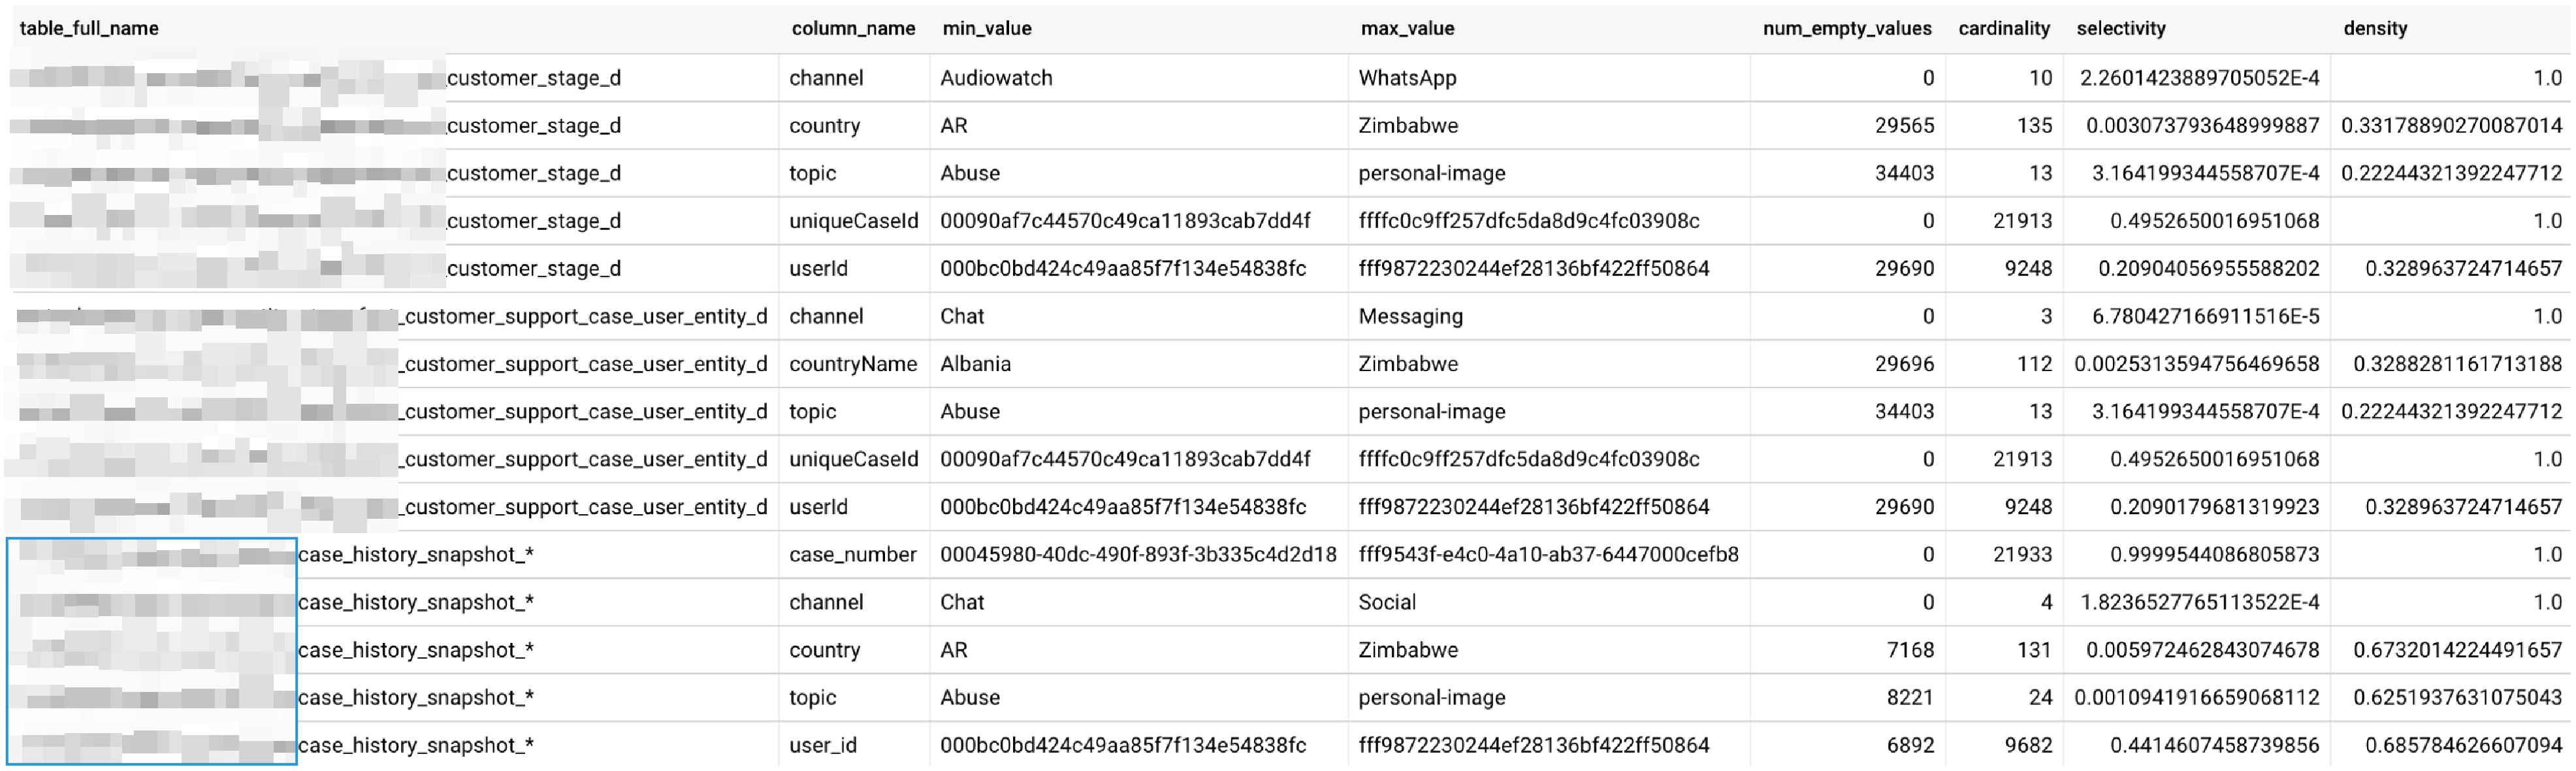
- Takes source table information as input parameters
- Iterates through specified columns in the source table
- Row count
- Min/max values
- Empty value count
- Unique value count
- Selectivity (unique values / total rows)
- Density (non-null values / total rows)
It then attempts to do the same for target table columns, though there's a bug in the target table section where it references col instead of tcn and doesn't use the target table name. The UNION ALL combines all these metrics into a single result set, creating a daily snapshot of table health that can be stored, visualized in Looker, and used for anomaly detection.Below is a sample output:
 The framework will:
• Run daily queries to compute stats
• Store results in an audit table
• Power Looker dashboards with this metadata or you can plug into any dashboard tools
The framework will:
• Run daily queries to compute stats
• Store results in an audit table
• Power Looker dashboards with this metadata or you can plug into any dashboard tools📈 Visualize in Looker
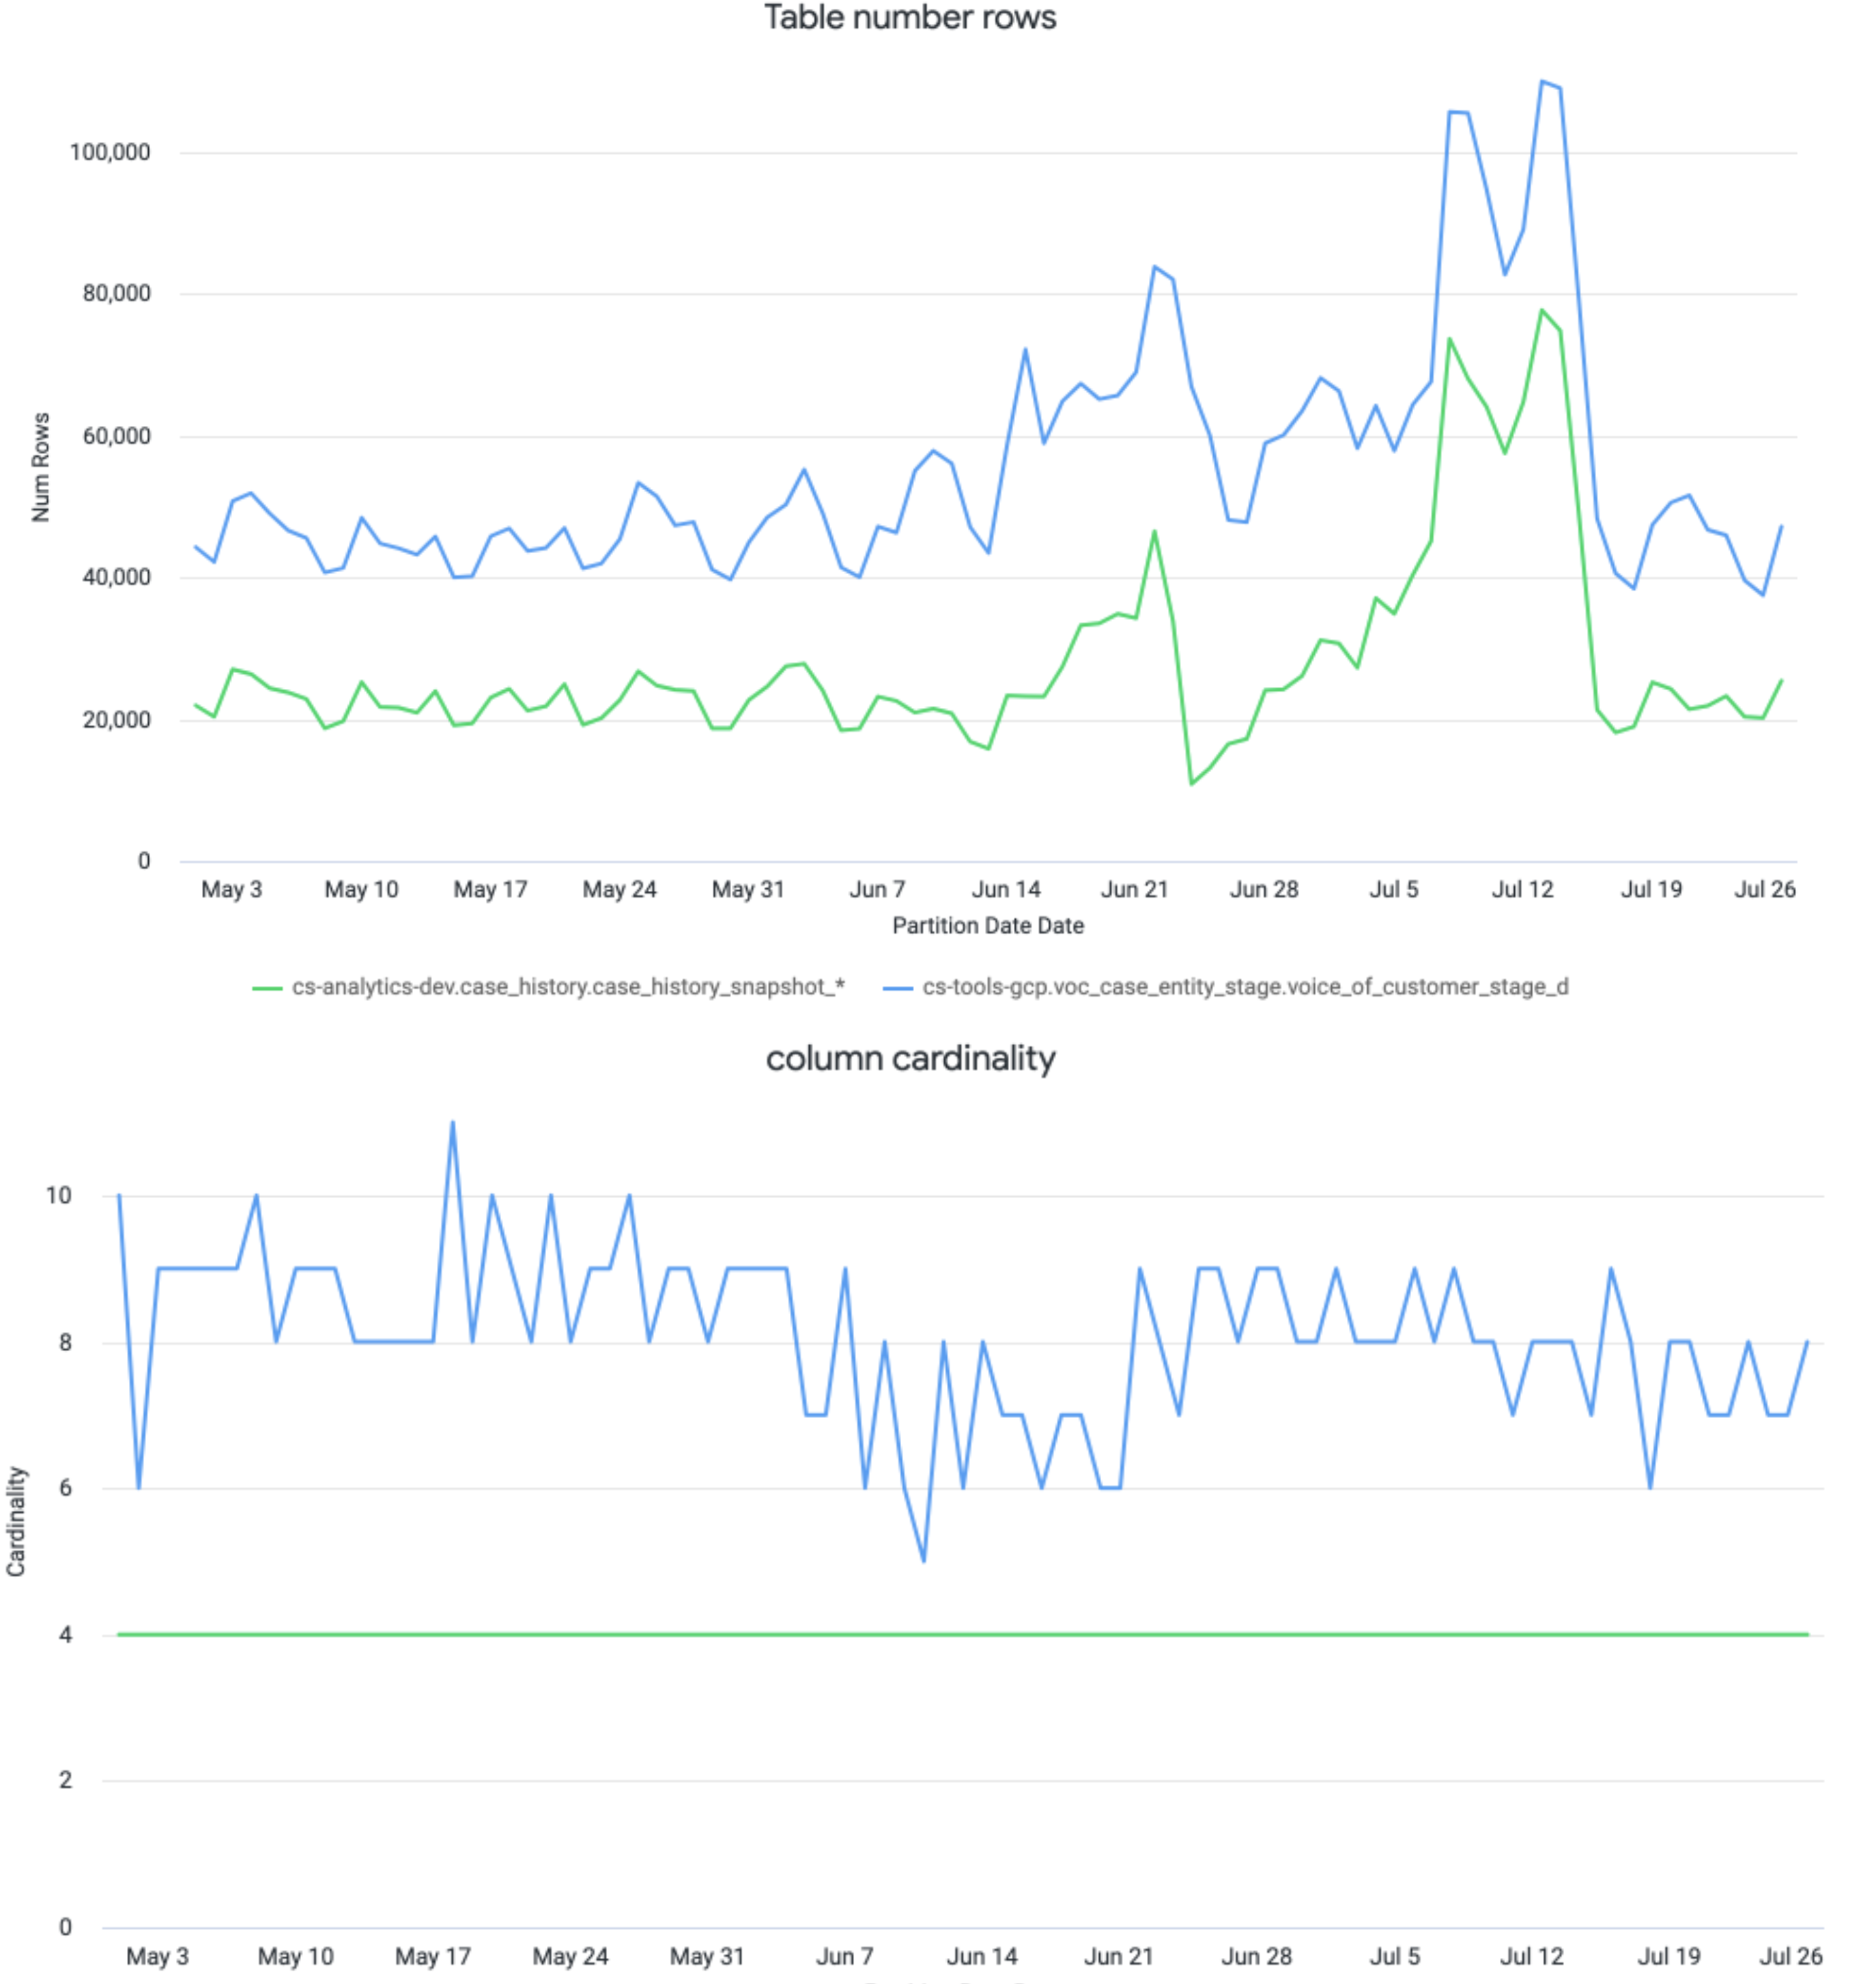
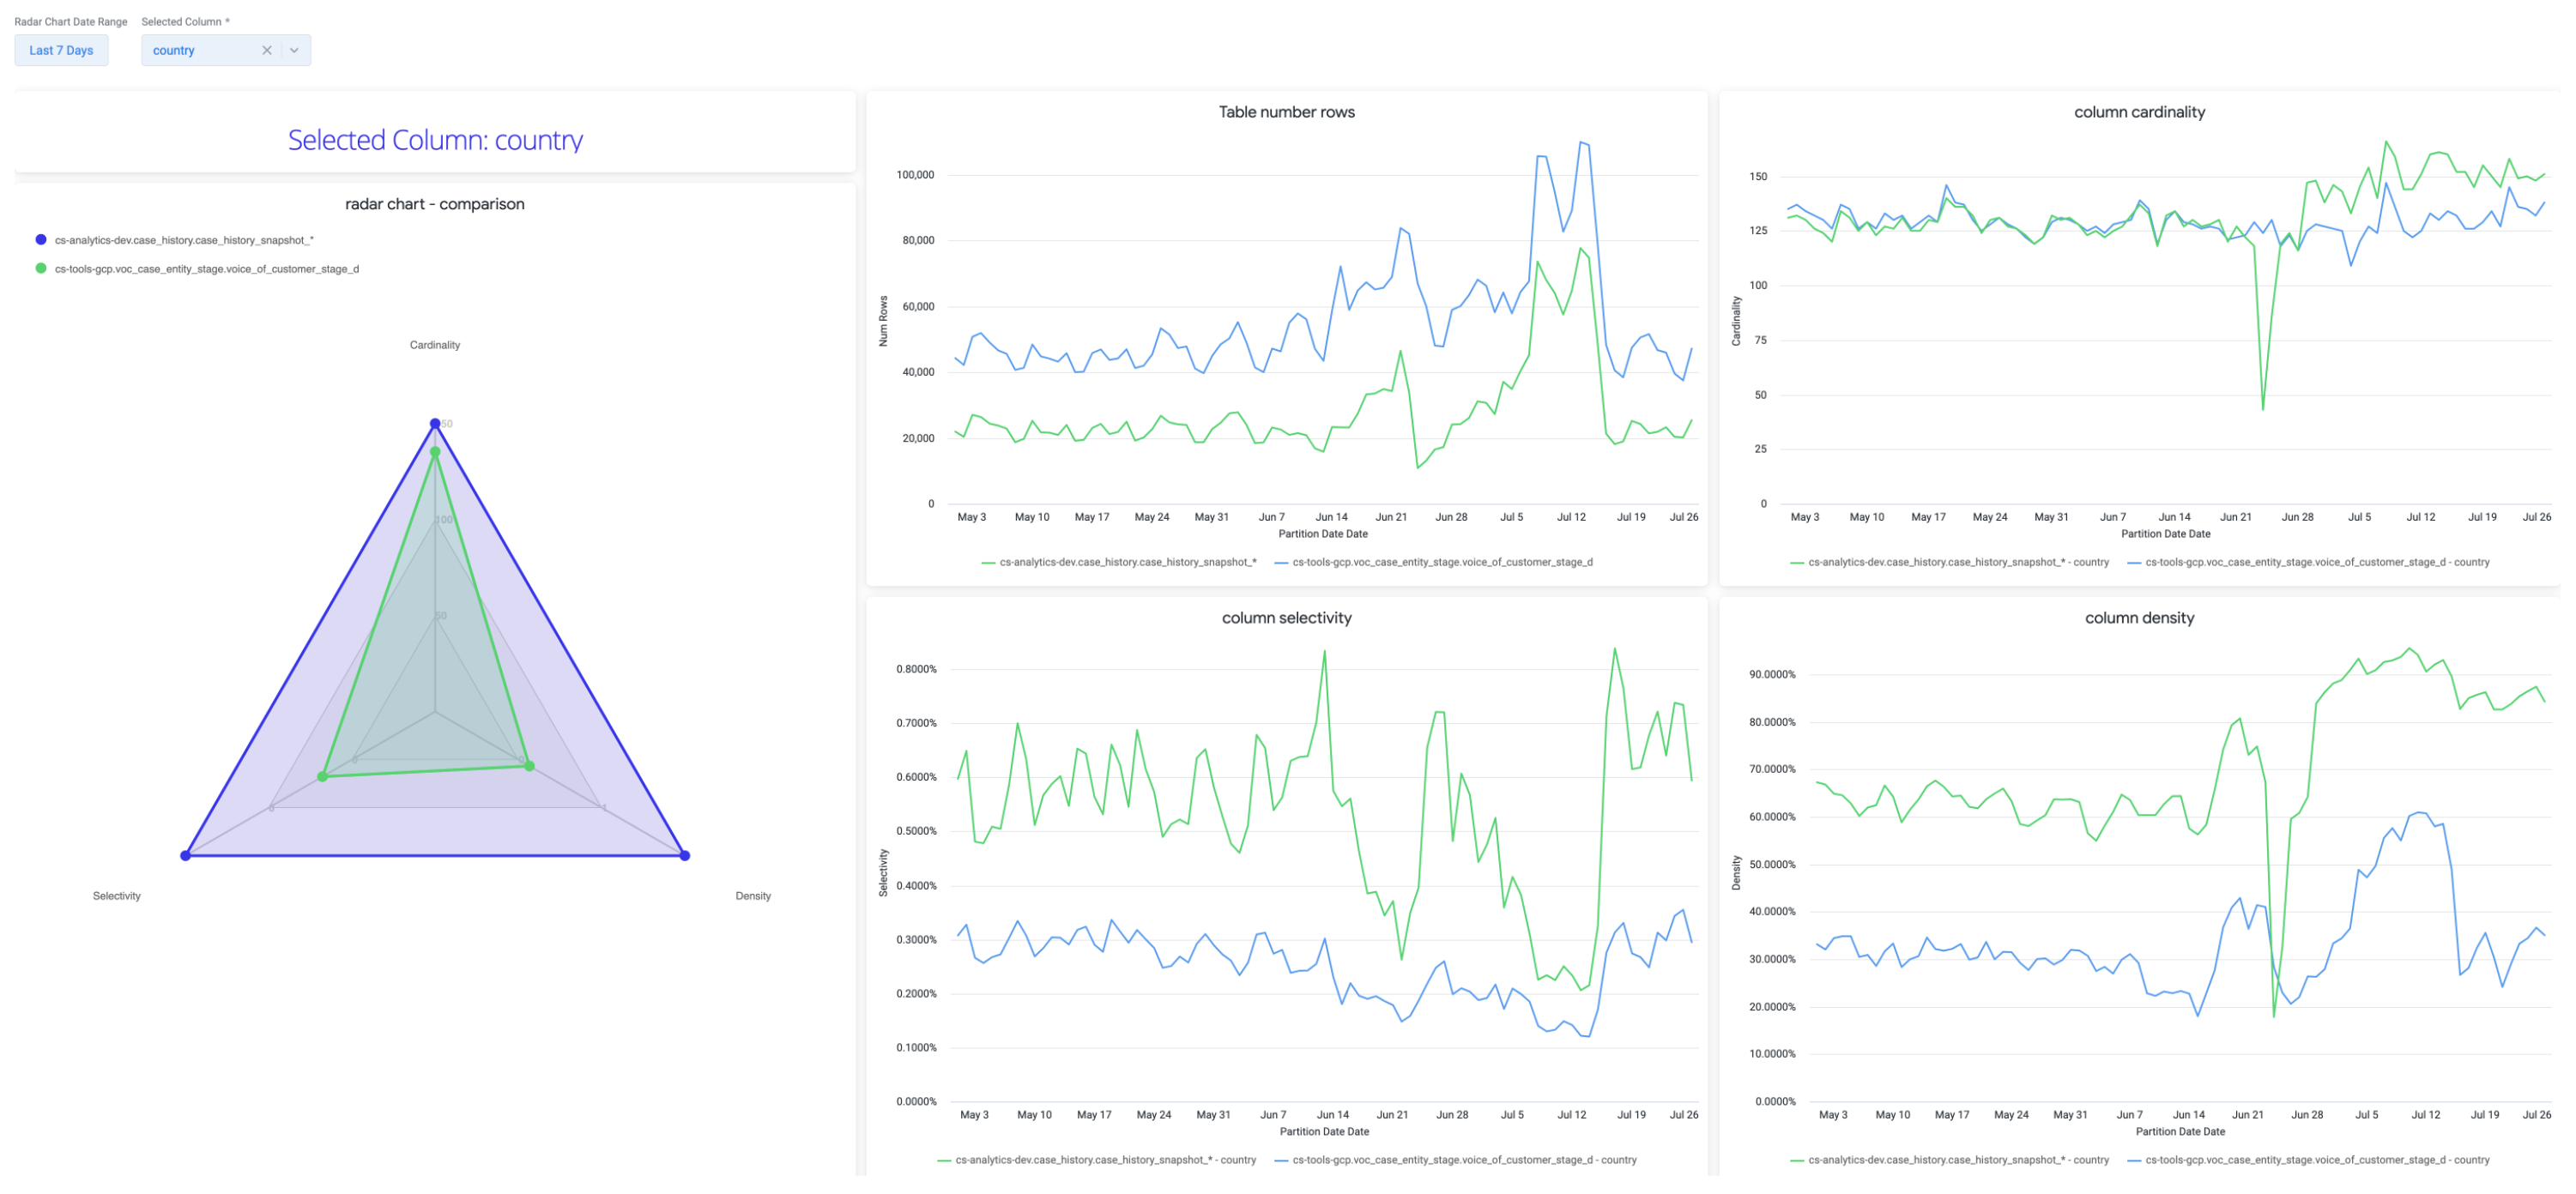 Use Looker dashboards to track table trends with intuitive visualizations:
• 🕸 Spider Chart: Compare each table to a “target” healthy shape
• 📉 Row Count: Overall row changes over time
• 🔢 Column Cardinality: Expect stability unless business logic changed
• 🔍 Selectivity & Density: Should remain steady for trusted columns
Use Looker dashboards to track table trends with intuitive visualizations:
• 🕸 Spider Chart: Compare each table to a “target” healthy shape
• 📉 Row Count: Overall row changes over time
• 🔢 Column Cardinality: Expect stability unless business logic changed
• 🔍 Selectivity & Density: Should remain steady for trusted columns
primary_key = 1, 100% is good
Rule of Thumb:
- 📊 Stable = Good. 👍
- Sudden change = Investigate. 🕵️♂️
Simple Threshold Alerts*:
• Row Count drops by >20,000
→ Might indicate upstream data loss
• Cardinality of 'channel' < 4
→ Might indicate tracking error or missing dimension

Simple Threshold Alerts*:
• Row Count drops by >20,000
→ Might indicate upstream data loss
• Cardinality of 'channel' < 4
→ Might indicate tracking error or missing dimensionyou need familiar with your business, know the generic trendSet alerts via a scheduled query + Slack webhook. Example use cases: • Sudden dip in data volume (e.g. user signups, transactions) • Business dimension suddenly missing (e.g. acquisition channels)
🍦 Why This Works
You don’t need a giant platform to catch most data issues. Just track the right signals, visualize the trends, and alert on anomalies.Because what really matters isn’t “Did the job run?” It’s: “Can I trust this Explore result?”