TL;DR
The spread and control of a pandemic can be modeled as a function of two key parameters:- Initial number of cases (n0)
- Basic reproduction number (R0)
- Testing & isolation strategies primarily affect n0, slowing disease spread.
- Vaccination & herd immunity reduce R0, exponentially decreasing transmission potential.
Disclaimer
The model is very macroscopic, very naive, and simplistic. This short article is more to provide everyone with a qualitative analysis based on a small amount of quantitative simulation. In simpler terms, you can understand this simulation as a mental model. After all, this is a blog post, so the derivation of the R₀ exponential return is simplified. You can click on this video to learn more about the visual derivation process and some extended reading [1][2] mentioned. At the same time, when this article was published, the world had already experienced more than three years of the "pandemic." Therefore, some basic concepts such as nucleic acid and vaccines will not be introduced in detail. Moreover, I am not a medical professional myself. I am more of an ordinary person doing some basic reasoning with a high school mathematics knowledge. Welcome everyone to point out any errors.Understanding Disease Growth and Control
The pandemic response is essentially a race to slow the growth rate of infections. Let n(t) represent the total number of infections at time.- If n(t) is increasing → More infections are occurring than recoveries.
- If n(t) is decreasing → Recoveries or immunity gains are outpacing new infections.
- If n(t) remains constant → The outbreak has stabilized, typically via herd immunity or sustained public health measures.
- Through [nucleic acid 🧪] testing, [we] continuously discover and monitor n, and then cooperate with medical measures and the process of natural recovery, of course, including death.
- Through [vaccine 💉] vaccination to reduce R₀*, because a large number of people have acquired immunity, preventing or slowing down the spread of the virus, which leads to a slower increase in n.
*Ractual: By vaccinating and increasing the vaccination rate of the population to form an immune barrier, the actual R₀ is reduced, resulting in a slower increase in the final n. In this way, with the addition of information and recovery, the final value of n can be reduced.
Assumption
In fact, nucleic acid testing itself does not directly treat infectious diseases. It is more about discovering positive cases, and then receiving targeted medical resources to slow down the growth rate of n and reduce the losses caused to the operation of society. Therefore, here, we do not set an upper limit for the medical resources invested after nucleic acid testing and vaccination, in order to simplify the discussion and reduce the number of parameters.ROI Implications
🧪🚧Testing & Isolation: Managing
n0- Reducing n0 yields a linear return: Identifying and isolating cases early prevents subsequent infections in a straightforward manner.
for i in [1, 2, 3, 4, ..., 10]:
Nucleic acid test i
Print nucleic acid test i result
- Rt: Return nucleic acid testing
- n: Number of people tested
- r: Benefit per positive case found
- It: Initial investment of the test
Key Takeaway
- The impact of testing is linearly proportional to the number of infections detected.
- If R0 is high, testing alone loses effectiveness—it must be complemented by vaccination.
💉Vaccination: Reducing
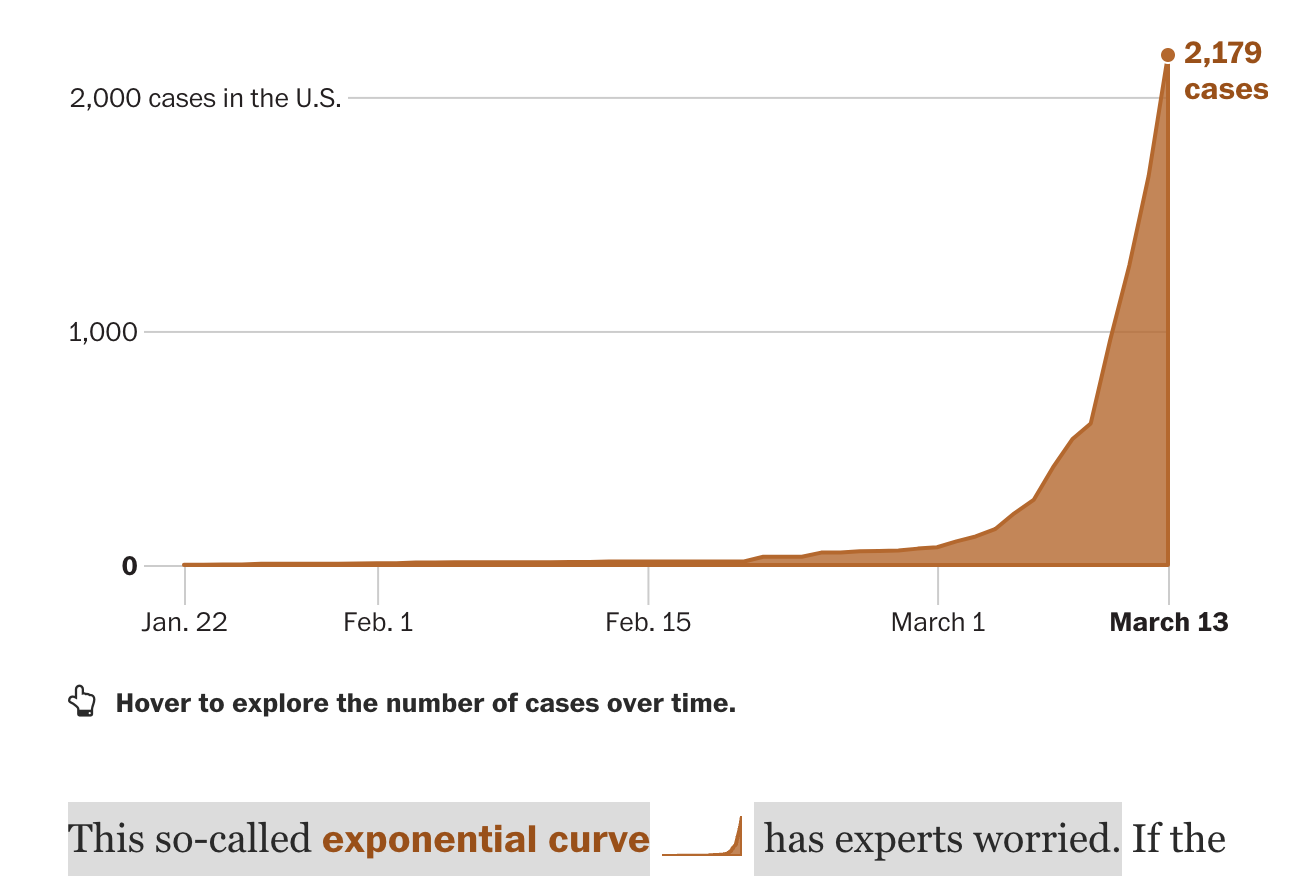
R0 for Exponential ReturnsHowever, when
R0 > 2, th
e spreading will become exponential
:
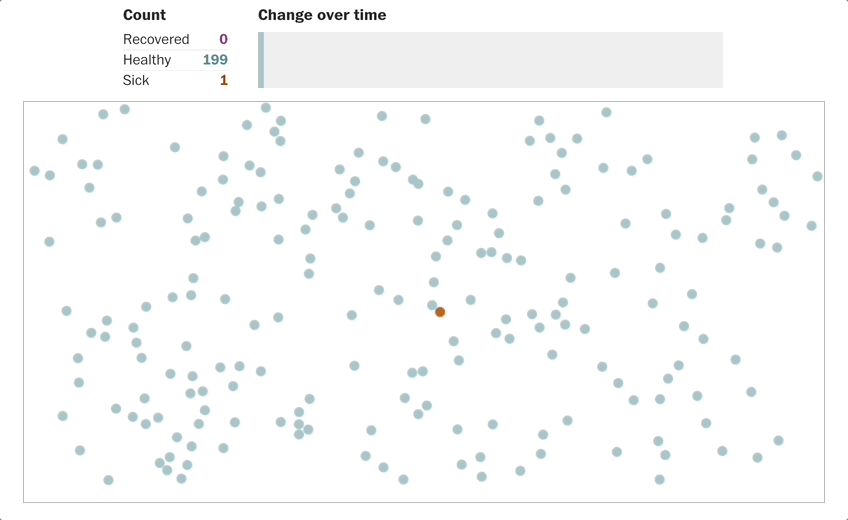 Source: R0 virus spreading simulation from Washington Post[1]
When the spreading becomes exponential, the testing won’t be able to catch up. Linear growth cannot keep up pace with exponential growth.
Source: R0 virus spreading simulation from Washington Post[1]
When the spreading becomes exponential, the testing won’t be able to catch up. Linear growth cannot keep up pace with exponential growth.
 The primary goal of vaccination is to lower R0 by increasing population immunity, reducing transmission rates. Unlike testing, which provides immediate but linear benefits, vaccination follows an exponential return curve:
Rv =R0f(n) −Iv
This is an exponential function, where:
The primary goal of vaccination is to lower R0 by increasing population immunity, reducing transmission rates. Unlike testing, which provides immediate but linear benefits, vaccination follows an exponential return curve:
Rv =R0f(n) −Iv
This is an exponential function, where:
- Rv = ROI of vaccination,
- f(n) = a function representing vaccine coverage in the population,
- Iv = initial vaccine development and distribution investment.
- When R0 >1, reducing R0 through vaccination leads to exponential reductions in cases.
- ROI increases significantly as more of the population is immunized, leading to herd immunity effects.
Comparing ROI of Testing vs. Vaccination
- 🧪Massive Test: Rt = n * r - It; Rt is the ROI of covid test
- 💉Massive Vaccination: Rv =R0f(n) −Iv
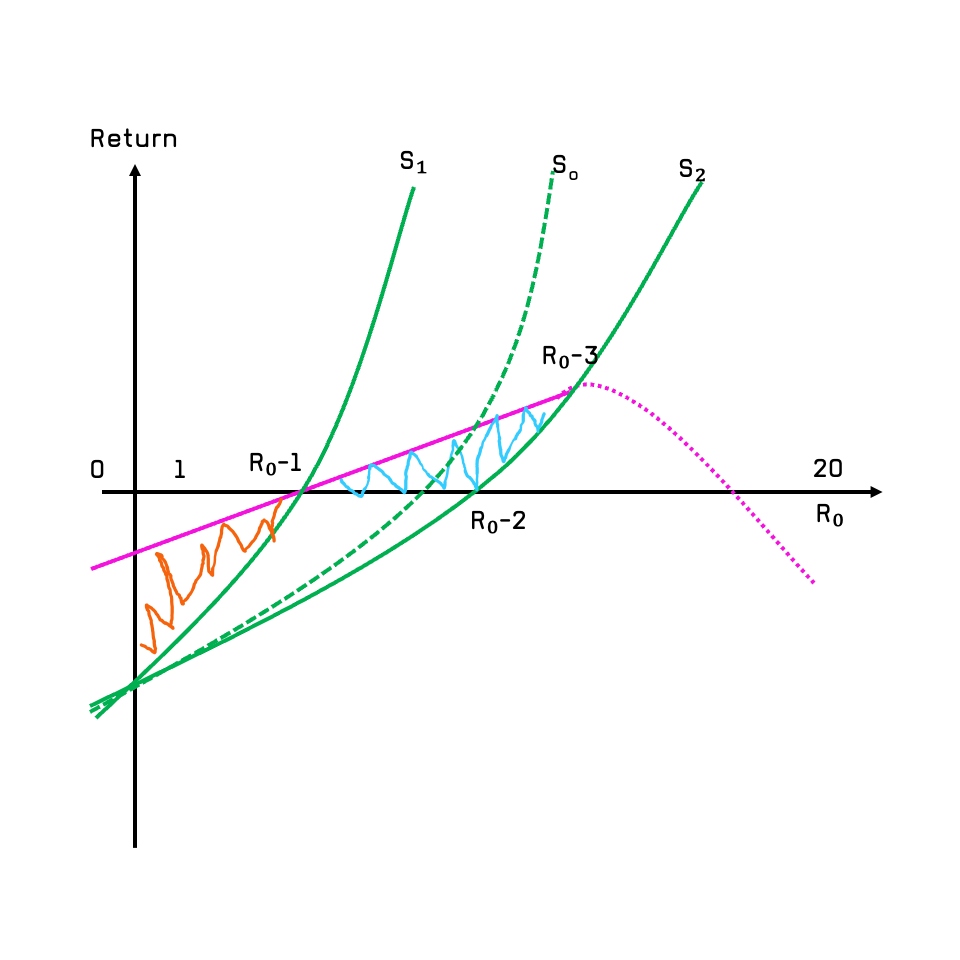
- X-axis: R0 values from 0 to 20
- Y-axis: ROI (return on intervention)
- S green lines are difference scenarios
- Purple solid line 🟪 → Linear ROI from testing
- Purple dashed line 🟪 → Testing effectiveness declines beyond a threshold R0
- Green solid line → Exponential ROI from vaccination
S1 Scenario
At a certain R₀ value, nucleic acid tests and vaccines are used simultaneously. Then the difference in overall benefit between the two ΔR = Rv - Rt is:The area under the green curve of S₁ on the X and Y axes minus the area under the purple solid line on the X and Y axes, which is the orange 🟧 shaded area since both are negative values.In the S₁ scenario, the benefit of using nucleic acid testing as the main means is greater than the benefit of using vaccination as the main means. The actual situation is that the huge upfront cost of vaccine development and time often lag behind the application of nucleic acid testing technology. This is determined by the inherent clinical research and development cycle to market.
S2 Scenario
When R₀ reaches a critical value, the benefit curve of nucleic acid testing will drop rapidly, especially when the growth rate of the number of positive cases n becomes larger and larger due to R₀. Doing nucleic acid tests will become a negative return. That is to say, after R₀₃ in the figure, in order to ensure comprehensive benefits, vaccines must be used as the main solution. The comprehensive benefit difference ΔR > 0Moving from S1 to S2 Scenario
This is what we essentially experiencing that the COVID’s R0 is increase from initial around 5 to now 10+ of variants.When R₀₁ < R₀ < R₀₂, for the green solid line with S₂ vaccine as the main focus, the benefit of the nucleic acid-based solution is still greater than that of the vaccine. This is the area of the blue 🟦 shadow in the figure. Of course, if the vaccine-based approach can be introduced earlier after R₀₁, there will actually be an optimal vaccination benefit curve S optimal between S₁ and S₂. The comprehensive benefit difference of this curve ΔR = 0, which is: The comprehensive benefit of nucleic acid testing is equal to the comprehensive benefit of vaccination, Rv = Rt
Key Observations
- Testing provides strong early ROI when cases are manageable (R0 is low).
- Vaccination dominates as R0 increases, preventing rapid outbreaks.
- There exists an optimal switch point Roptimal , where public health measures should shift from testing to vaccination.
Policy Implications
- Early Phase of an Outbreak:
- Testing and isolation are cost-effective as R0 is low and cases are trackable.
- Mid-Pandemic Response:
- As R0 increases, testing loses cost-effectiveness, and mass vaccination must take over.
- Long-Term Strategy:
- If vaccination is deployed early, the exponential benefits outweigh short-term testing strategies.
Final Takeaways
- Mitigation measures (e.g., lockdowns, testing) are effective when transmission is low.
- Vaccination is the most scalable long-term solution, offering exponential benefits.
- A data-driven, adaptive policy should switch strategies based on the real-time growth rate of infections.
I believe this model effectively explains China’s successful containment of the pandemic from 2019 to 2021, but unfortunately, the zero-COVID policy is now facing challenges and has had a significant impact on the lives and economy of its people, especially in 2022 when COVID virus become extremely contagious while isn’t that fatal given now vaccination is available.
Further Reading
The idea for this article was conceived around April or May of 2022. Then, on November 21, 2022, New York City published an article[3] detailing the benefit calculation of New York City's vaccine rollout campaign. It was very detailed and calculated that every $1 spent brought $10.19 in return (through reduced infection rates, mortality rates, decreased loss of efficiency, and optimized use of medical resources). That's almost a 10x return, which is an exponential return. LICENSE: CC BY-SA 4.0🔗- 1. https://www.facebook.com/washpostvisuals (2020). Why outbreaks like coronavirus spread exponentially, and how to ‘flatten the curve’. [online] Washington Post. Available at: https://www.washingtonpost.com/graphics/2020/world/corona-simulator/ [Accessed 17 Dec. 2022]. ↩
- 2. Meltingasphalt.com. (2022). Outbreak. [online] Available at: https://meltingasphalt.com/interactive/outbreak/[Accessed 17 Dec. 2022]. ↩
- 3. Return on Investment of the COVID-19 Vaccination Campaign in New York City | Public Health | JAMA Network Open | JAMA Network ↩